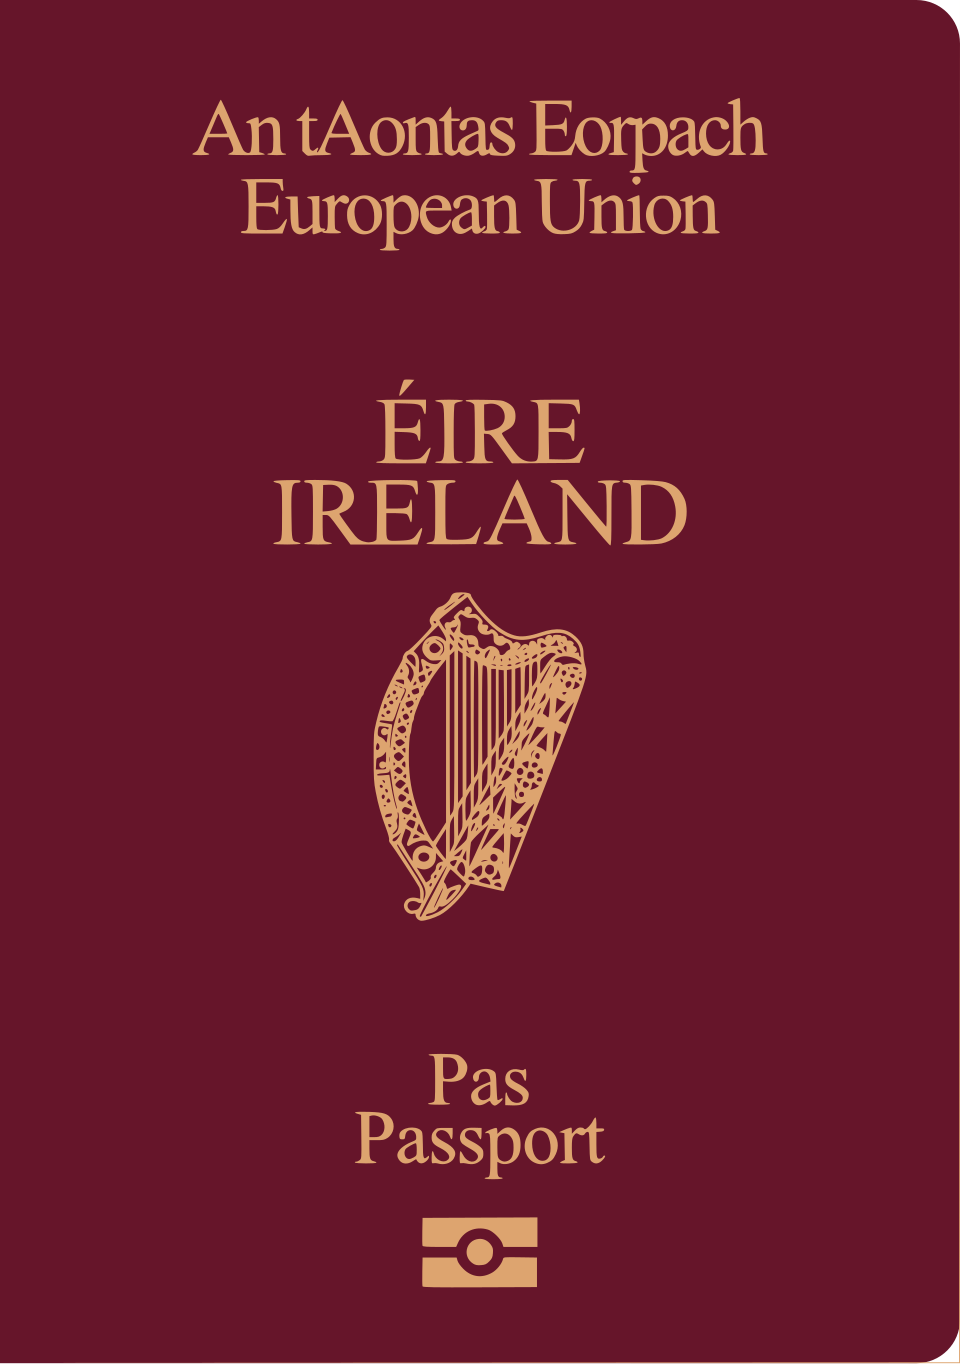
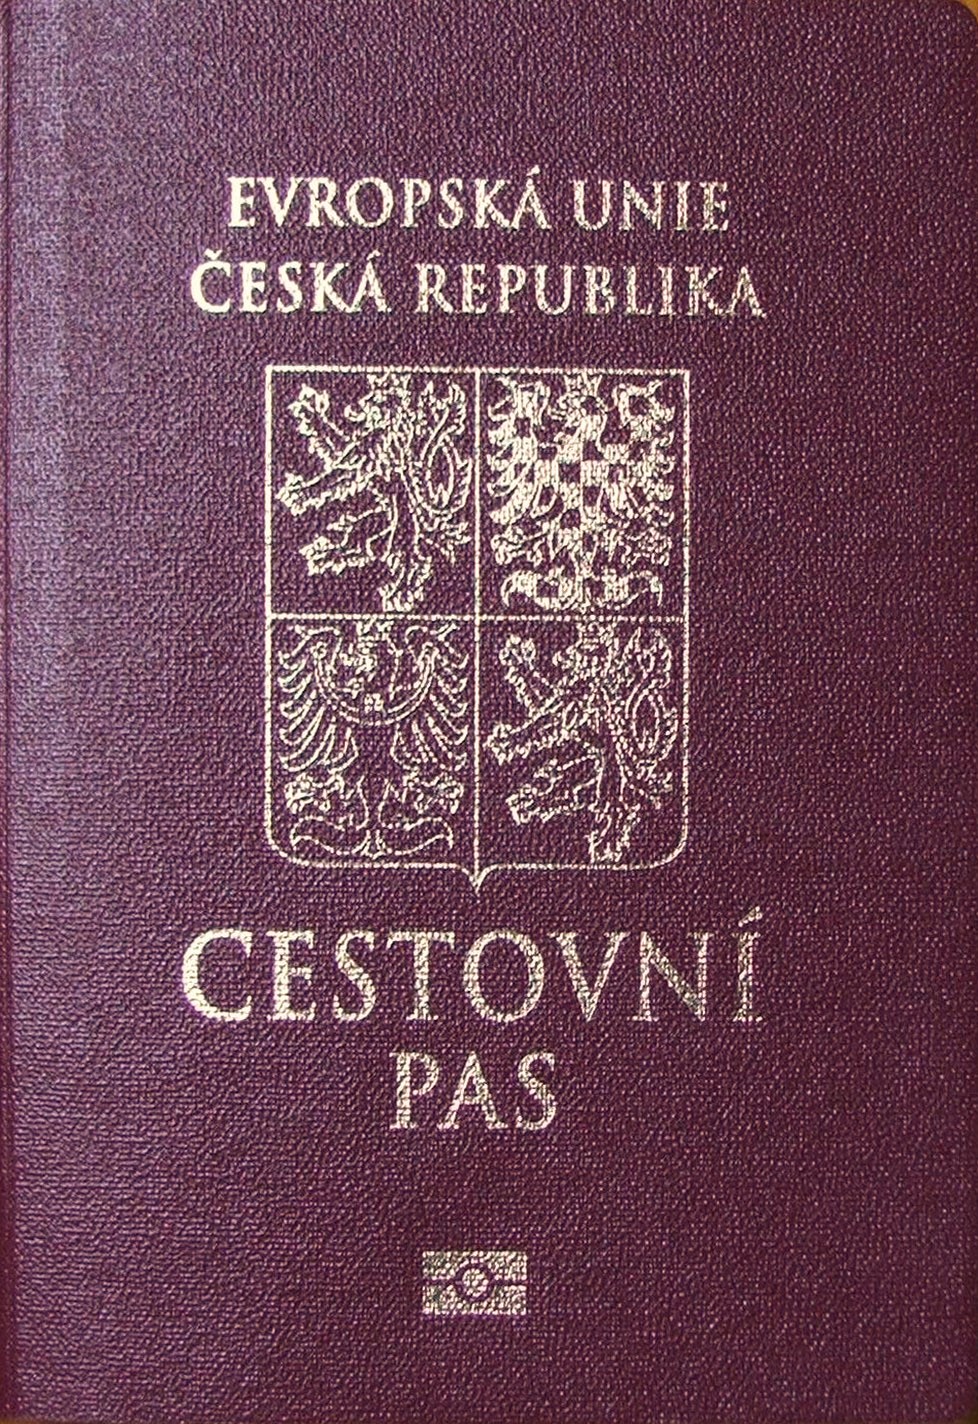
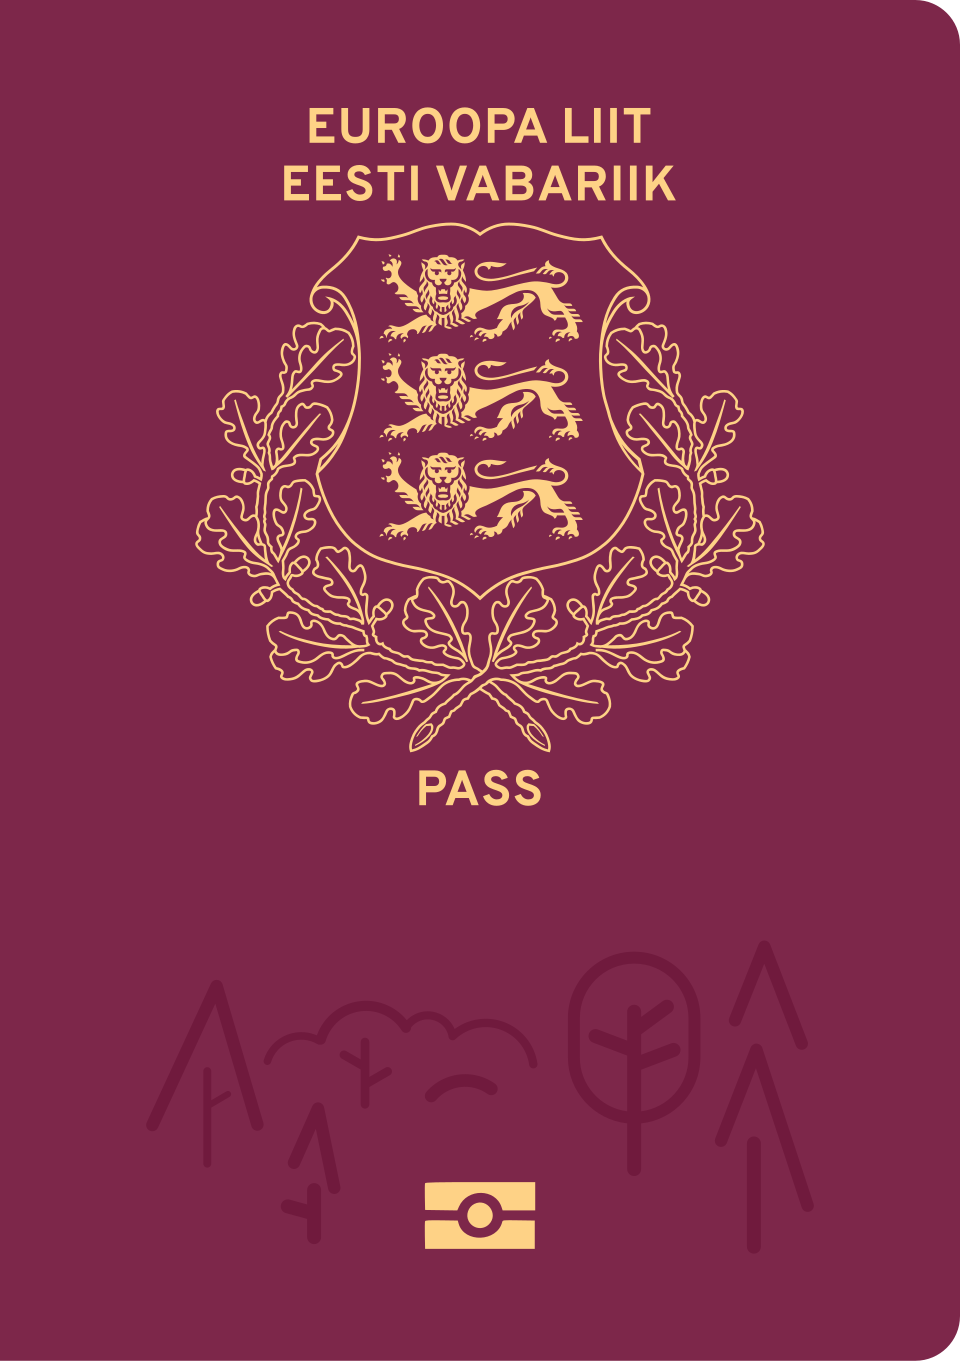
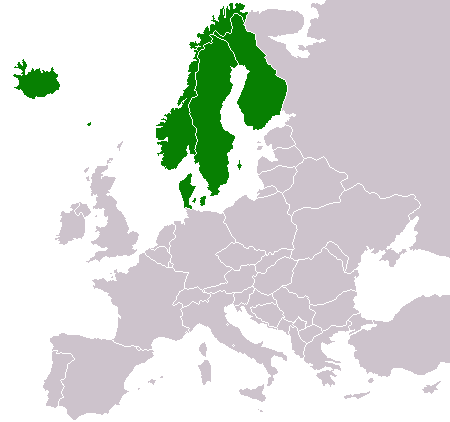
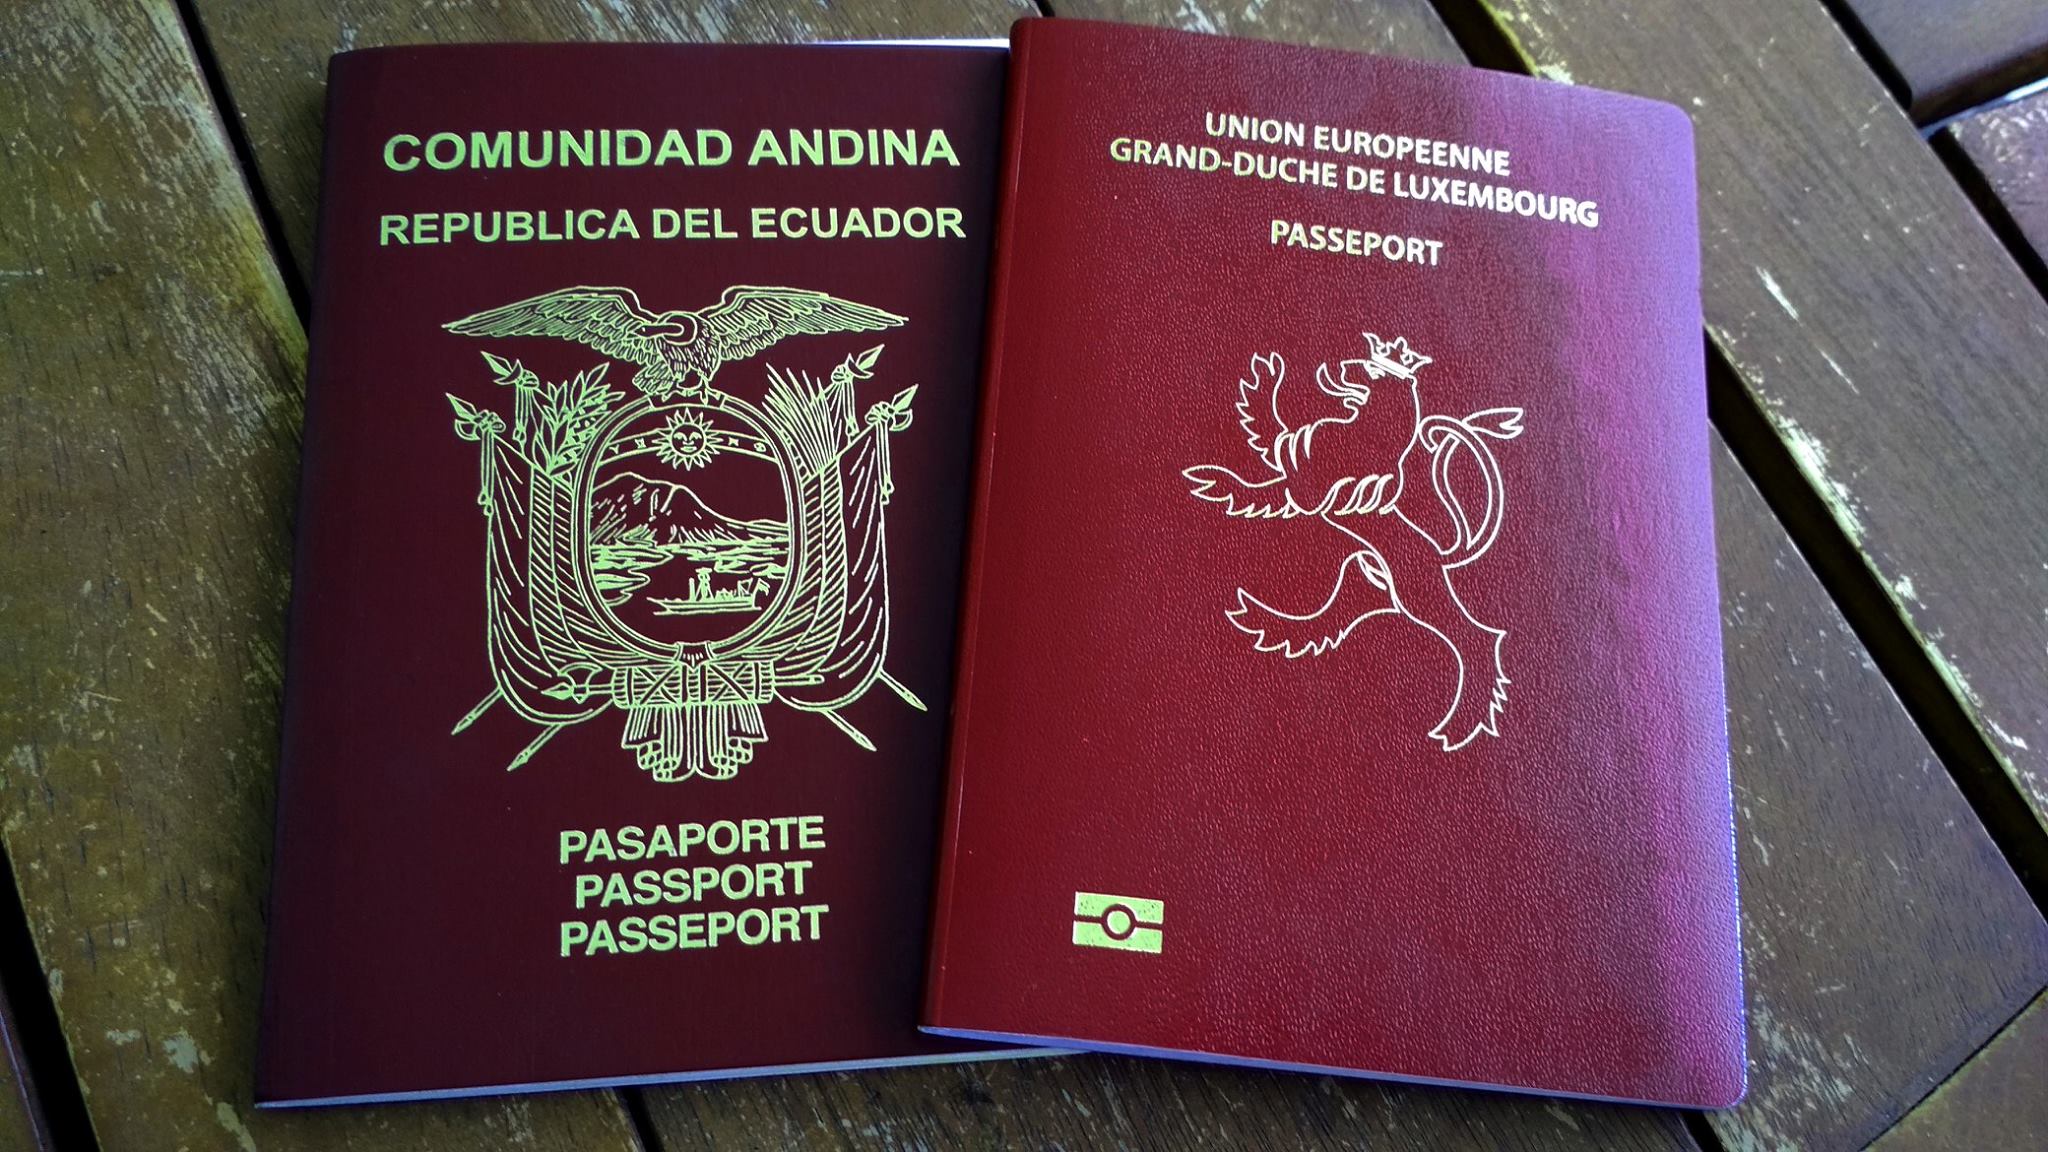
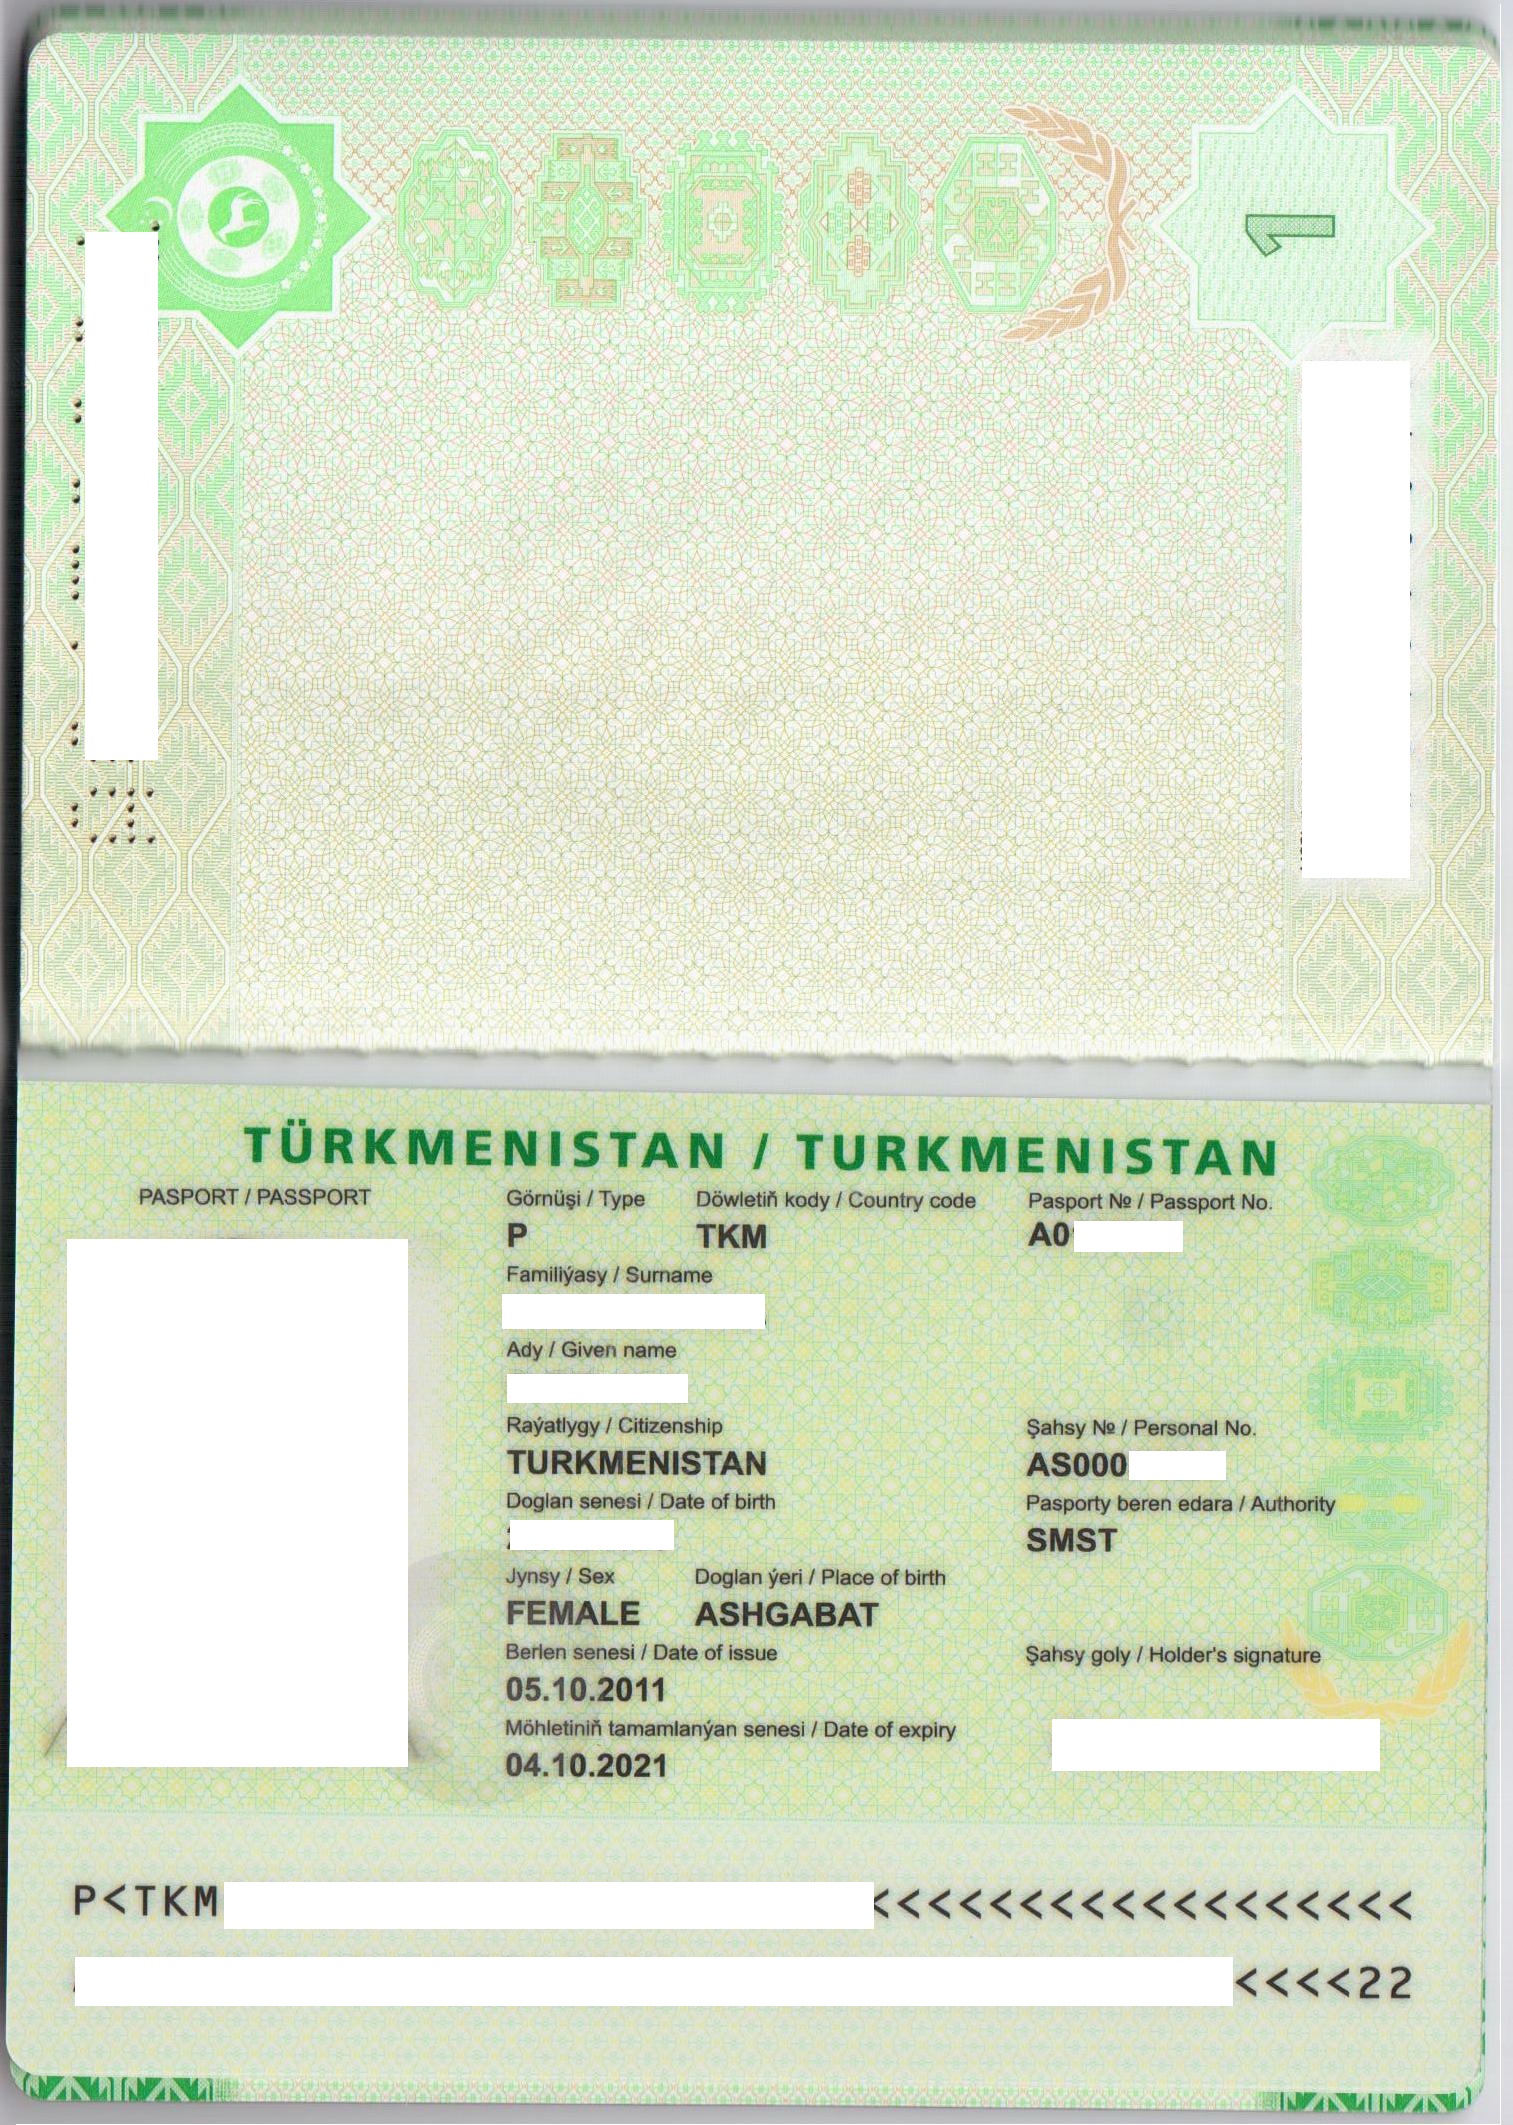
Most passport rankings count how many countries you can visit. We think that misses the point. A passport is worth what it lets you do with your life, so the Lucky Nomads Passport Index weights every destination by how livable it is and rewards the right to settle, not just the right to pass through. The Irish passport leads with 88.52 out of 100, ahead of Czech (88.43) and Estonian (88.13). This view ranks 200 passports.
The Lucky Nomads Passport Index blends four pillars into a single score out of 100, with the weights published in full below. Alongside the official score we show a pure mobility score, the familiar count of where you can go without a prior visa. It is a reference point only and carries exactly zero weight, which is what lets you see where travel power and living power diverge.
Access weighted by livability
40%
Every destination you can reach, weighted by the quality of access and by how livable the place is. Livability counts squared, so reaching places that are genuinely good to live in dominates and a long tail of low-livability stamps buys very little.
Residence rights
25%
The right to live and work somewhere permanently, not merely visit. Each free-movement destination counts by its livability, with diminishing returns as the list grows.
Tax friendliness
20%
How your citizenship treats you on taxes, including a penalty for the rare countries that tax citizens on worldwide income wherever they live.
Optionality and freedom
15%
The governance, openness and rule of law of your home country, because a passport is also a fallback plan.
Pure mobility is the familiar visa-free count, scaled to 100. We show it next to the official score for reference. It weighs exactly 0% of the composite.
Frequently asked questions
How is the Lucky Nomads Passport Index different from the usual passport rankings?
The familiar rankings count destinations you can enter without a prior visa and stop there. We go further. We weight each destination by how good it is to live in, we reward the right to reside rather than just visit, and we factor in how your citizenship taxes you. Two passports with the same visa-free count can land far apart in our ranking.
Why do some travel-strong passports rank lower here?
A passport can open many borders for short tourist stays yet grant the right to settle in almost none. Singapore sits near the top of every pure mobility count and lands far lower here for exactly that reason. Our score rewards the freedom to actually live and work somewhere, so passports rich in free-movement rights rise and pure tourist mobility counts for less.
What is the pure mobility score shown next to the main score?
It is a breadth count of where you can go without applying for a visa first, scaled to 100. The four pillars carry weights of 40, 25, 20 and 15 percent, and pure mobility carries exactly zero. We show it on purpose, next to the official score, so you can compare the familiar measure against our livability-weighted view and see where they diverge.
What is the reality gap?
It is a passport's pure mobility rank minus its Lucky Nomads rank. A large negative gap marks a passport that travels far better than it lets you live, so visa-free counts flatter it. A large positive gap marks one that visa-free counts underrate, usually thanks to strong residence rights or friendly taxation.
How often is the index updated?
The index is recomputed from our bilateral visa-access matrix and our livability data on a regular cycle, so changes in visa rules and country scores flow through automatically.
Free diagnostic
Which passport fits your life plan?
GeoCompass weighs your citizenships, tax exposure and where you want to live into one personalized plan.
Researched from official sources, leading global indices and Lucky Nomads' own scoring.
Lucky Nomads research
Lucky Nomads Passport Index
Most passport rankings count how many countries you can visit. We think that misses the point. A passport is worth what it lets you do with your life, so the Lucky Nomads Passport Index weights every destination by how livable it is and rewards the right to settle, not just the right to pass through. The Irish passport leads with 88.52 out of 100, ahead of Czech (88.43) and Estonian (88.13). This view ranks 200 passports.
The Lucky Nomads Passport Index blends four pillars into a single score out of 100, with the weights published in full below. Alongside the official score we show a pure mobility score, the familiar count of where you can go without a prior visa. It is a reference point only and carries exactly zero weight, which is what lets you see where travel power and living power diverge.
Access weighted by livability
40%
Every destination you can reach, weighted by the quality of access and by how livable the place is. Livability counts squared, so reaching places that are genuinely good to live in dominates and a long tail of low-livability stamps buys very little.
Residence rights
25%
The right to live and work somewhere permanently, not merely visit. Each free-movement destination counts by its livability, with diminishing returns as the list grows.
Tax friendliness
20%
How your citizenship treats you on taxes, including a penalty for the rare countries that tax citizens on worldwide income wherever they live.
Optionality and freedom
15%
The governance, openness and rule of law of your home country, because a passport is also a fallback plan.
Pure mobility is the familiar visa-free count, scaled to 100. We show it next to the official score for reference. It weighs exactly 0% of the composite.
Frequently asked questions
How is the Lucky Nomads Passport Index different from the usual passport rankings?
The familiar rankings count destinations you can enter without a prior visa and stop there. We go further. We weight each destination by how good it is to live in, we reward the right to reside rather than just visit, and we factor in how your citizenship taxes you. Two passports with the same visa-free count can land far apart in our ranking.
Why do some travel-strong passports rank lower here?
A passport can open many borders for short tourist stays yet grant the right to settle in almost none. Singapore sits near the top of every pure mobility count and lands far lower here for exactly that reason. Our score rewards the freedom to actually live and work somewhere, so passports rich in free-movement rights rise and pure tourist mobility counts for less.
What is the pure mobility score shown next to the main score?
It is a breadth count of where you can go without applying for a visa first, scaled to 100. The four pillars carry weights of 40, 25, 20 and 15 percent, and pure mobility carries exactly zero. We show it on purpose, next to the official score, so you can compare the familiar measure against our livability-weighted view and see where they diverge.
What is the reality gap?
It is a passport's pure mobility rank minus its Lucky Nomads rank. A large negative gap marks a passport that travels far better than it lets you live, so visa-free counts flatter it. A large positive gap marks one that visa-free counts underrate, usually thanks to strong residence rights or friendly taxation.
How often is the index updated?
The index is recomputed from our bilateral visa-access matrix and our livability data on a regular cycle, so changes in visa rules and country scores flow through automatically.
Free diagnostic
Which passport fits your life plan?
GeoCompass weighs your citizenships, tax exposure and where you want to live into one personalized plan.